
How to Look Up San Mateo County Jail Population Data
San Mateo County jail population data lives across three official feeds. The Sheriff's Corrections Division page at smcsheriff.com/corrections-division names both facilities and links agency reports. The California Board of State and Community Corrections, known as the BSCC, publishes county-level jail data on a quarterly cycle at bscc.ca.gov. The Bureau of Justice Statistics, or BJS, runs an annual jail census and a yearly survey at bjs.ojp.gov. The Sheriff also runs a live custody locator at smc-inmatelocator.org, which is a per-person tool, not a population dashboard.
Each data feed shows different numbers. The Sheriff page lists the two San Mateo County jails and short program details. BSCC reports show rated capacity, average daily population, pretrial and sentenced shares, and average length of stay for the county. BJS reports show national and state totals, plus rates per 100,000 residents. Read BSCC for county counts, read BJS for context, and read the live locator for one-person status checks. Update cadence runs daily for the locator, quarterly for BSCC, and yearly for BJS.
San Mateo County jail oversight starts at the Sheriff's Corrections Division. The image links to the official Sheriff page at smcsheriff.com/corrections-division.
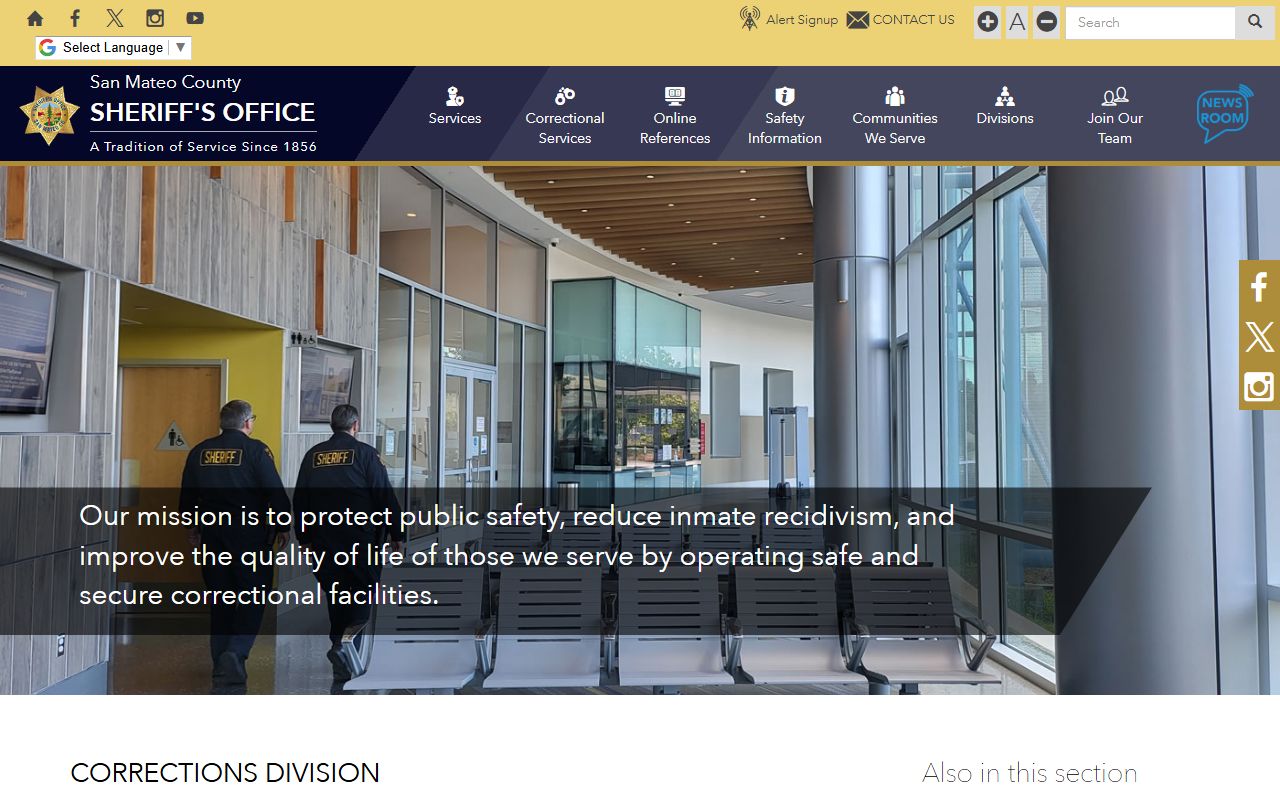
San Mateo County Jail Capacity Overview
San Mateo County runs two jail sites in Redwood City. Maguire Correctional Facility sits at 300 Bradford Street. Maple Street Correctional Center sits at 1300 Maple Street and is a 260,000 square foot modern facility opened to expand programming space and to move the full female custody population from older county housing. Maximum capacity figures vary by source and year. A 2020 Sheriff news release cited Maguire at 684 beds and Maple Street at 832 beds, for a combined dated capacity of 1,516. Older Civil Grand Jury records cited Maguire near 688. Current BSCC rated capacity should be used for live figures.
| Facility | Rated Capacity (dated) | Source / Date |
|---|---|---|
| Maguire Correctional Facility | 684 beds (2020); 688 in older reports | Sheriff news release, 2020; Civil Grand Jury, prior years |
| Maple Street Correctional Center | 832 beds (2020) | Sheriff news release, 2020 |
| Combined county total | 1,516 beds (2020 figures) | Sum of Sheriff 2020 figures |
Note: The Sheriff's Office has not posted a current rated capacity on the active Corrections Division page, so the BSCC Jail Profile Survey is the best source for a live figure.
Average Daily Population
Average daily population, or ADP, is the mean count of inmates held each day during a set period. BSCC tracks ADP for every county jail in the state. A current official San Mateo County daily jail population dashboard with a public five-year ADP table is not posted on the active Sheriff site. The BSCC Jail Profile Survey is the standard public source for ADP, average length of stay, and pretrial share at the county level. The Sheriff's annual report and county budget books also publish ADP for the prior fiscal year.
Two factors shape San Mateo County ADP. First, the county jails hold pretrial defendants on local charges plus people serving short sentences under California Penal Code 1170(h), so any change in charging or sentencing volume shifts ADP. Second, court calendar speed sets pretrial length of stay. When courts run slow, pretrial counts rise. When courts run normal speed, pretrial counts drop. BSCC quarterly data and county budget books show these shifts year over year.
Demographic Breakdown
Demographic data covers gender, race, ethnicity, and age. BSCC tracks gender at the facility level. BJS tracks race and ethnicity in national jail reports and lets users compare local figures to state and national rates. The Sheriff says Maple Street holds the county's female custody population after the 2015 facility opening shifted women from older housing. Maguire holds mostly male custody. The table below shows a typical California county jail mix. Use the BSCC site for the most recent San Mateo County figures.
| Group | Share (state context) |
|---|---|
| Male | about 87% statewide |
| Female | about 13% statewide |
| Hispanic or Latino | about 47% statewide |
| White, not Hispanic | about 23% statewide |
| Black or African American | about 20% statewide |
| Asian, Pacific Islander, or Other | about 10% statewide |
| Under age 25 | about 18% statewide |
State-level shares come from BSCC and BJS reporting. San Mateo County numbers track the broader Bay Area mix, with a smaller Black share than the state mean and a larger Hispanic and Asian share, due to county population makeup. For exact county figures, the BSCC Jail Profile Survey is the official source.
Pretrial vs Sentenced Population
Pretrial means held while a case is open and no sentence has run. Sentenced means held to serve time after a guilty plea or verdict. California county jails skew pretrial because Penal Code 1170(h) sends many low-level felony sentences to county jail instead of state prison, but pretrial defendants on serious charges still make up the larger share. BJS reports show U.S. jails run near 70% pretrial across all counties. BSCC data shows California county jails near that mark in most years. San Mateo County follows the state pattern.
| Status | Share (typical California county) |
|---|---|
| Pretrial | about 65% to 72% |
| Sentenced | about 28% to 35% |
The pretrial share in San Mateo County is shaped by court calendar speed, bail decisions, and the use of pretrial release programs. The Superior Court of California, County of San Mateo runs a release program through Pretrial Services, which can lower pretrial counts. For the most recent share, check the BSCC quarterly report or the Sheriff's annual report.
Misdemeanor vs Felony Population
Most people held in San Mateo County jails face felony charges. BJS data shows U.S. jails hold roughly 60% felony and 40% misdemeanor on a typical day, with felony shares higher in counties that hold realigned sentences under California Penal Code 1170(h). San Mateo County tracks that pattern. Felonies cover serious crimes like assault, robbery, burglary, and certain drug offenses. Misdemeanors cover lower-level cases like simple battery, petty theft, DUI, and trespass. Felony cases run longer in custody, which drives the felony share up.
A small share of the jail population is held on warrants, holds from other counties, federal holds, or probation and parole violations. These cases are not new charges. They are detainers from other jurisdictions or from the same court. The Sheriff books people on all of these reasons. For a breakdown of current arrest cases that feed the jail, see the San Mateo County arrest records page.
Mental Health and Medical Population
Mental health and medical needs drive a large share of jail resources. National BJS data shows that roughly two thirds of jail inmates report mental health issues at some point in custody, and one in seven receive ongoing medical care during their stay. The Sheriff's Office screens every booked person for mental health and medical needs as part of intake. Maple Street Correctional Center was built with expanded program space to support these needs. The Sheriff's family-support and inmate programs page lists cognitive behavioral, education, vocational, and activity-based programs running inside both jails.
The California Board of State and Community Corrections sets jail standards and publishes county data. The image links to bscc.ca.gov.
Service League of San Mateo County runs in-custody and family support programs and has worked with the Sheriff for over 50 years. Contact Service League at (650) 364-4664. The county's mental health staff and contract medical staff handle clinical care inside the jails. Court-ordered competency cases route through the Superior Court mental health calendar.
National and State Context
Putting county counts next to state and national rates makes the data easier to read. The federal Bureau of Justice Statistics tracks the national jail rate per 100,000 residents at bjs.ojp.gov. The California Board of State and Community Corrections tracks the state rate at bscc.ca.gov. The table below shows recent BJS and BSCC figures for context. The San Mateo County rate runs below the state and national rate because the county runs a robust pretrial release program and has a smaller per capita arrest volume than many California counties.
| Level | Jail Population per 100,000 (recent) | Source |
|---|---|---|
| San Mateo County | about 100 to 130 | BSCC Jail Profile Survey |
| California | about 175 to 200 | BSCC statewide data |
| United States | about 200 to 230 | BJS annual jail census |
Note: San Mateo County rates are county-specific. State and national rates pull from BSCC and BJS reports and serve as context only. Each rate is a per capita figure, not a raw count.
The Bureau of Justice Statistics publishes the national jail census each year. The image links to bjs.ojp.gov.
Population Trends Over Time
San Mateo County jail population trends track three big shifts. First, California Public Safety Realignment in 2011, also called AB 109, moved many low-level felony sentences from state prison to county jail. ADP rose in most California counties after AB 109. Second, the opening of Maple Street Correctional Center in 2015 added modern beds, allowed female custody to move out of older housing, and grew program space. Third, the 2020 to 2022 pandemic period dropped jail counts as courts slowed and pretrial release expanded. Counts have moved back up since.
Long-run trend data for San Mateo County is best read from BSCC quarterly reports and county budget books. The Civil Grand Jury also produces periodic jail reports that cover capacity, ADP, and program use. Sheriff governance changed in late 2025 with the appointment of Sheriff Kenneth Binder, sworn in on November 12, 2025 as the county's 27th Sheriff. The Sheriff's Office updated its Lexipol corrections manual under Sheriff Binder in 2026, which may shift booking and release procedures going forward.
Bay Area jail counts have run below the state mean for years, partly because of strong pretrial release programs and partly because of lower per capita arrest volume. San Mateo County follows that pattern. The county jail does not hold federal detainees under a long-term contract, and ICE holds are limited by the California Values Act under Government Code section 7282.5. For people sent to state prison, the California Department of Corrections and Rehabilitation publishes population reports at cdcr.ca.gov.
Searching for San Mateo County Inmate Records by Name
The data above covers aggregate jail population, not individual custody status. To look up one person by name on the live jail roster, use the San Mateo County inmate records page, which routes to the Sheriff Inmate Locator at smc-inmatelocator.org. For release verification or post-release records, see the San Mateo County released inmates page.
Where the Data Comes From
Three official sources feed San Mateo County jail population data. The Sheriff's Office reports operating data through the Corrections Division at smcsheriff.com/corrections-division and through annual reports and budget documents posted on the county site. The Sheriff also runs the live custody locator at smc-inmatelocator.org. The California Board of State and Community Corrections runs the Jail Profile Survey and the Adult Detention Survey, both at bscc.ca.gov. BSCC also inspects every county jail in California on a fixed cycle and posts inspection reports.
At the federal level, the Bureau of Justice Statistics publishes the Annual Survey of Jails, the Census of Jails, and a yearly report on jail inmate counts at bjs.ojp.gov. The U.S. Marshals Service tracks federal detainees held in local jails. The Civil Grand Jury of San Mateo County also produces periodic jail reports that cover capacity, ADP, mental health staffing, and program use. For state prison data, the California Department of Corrections and Rehabilitation publishes monthly population reports at cdcr.ca.gov.
The U.S. Court of Appeals for the Ninth Circuit hears federal appeals from California, including challenges to jail and prison conditions. The image links to ca9.uscourts.gov.

Note: For a current per capita figure, pair BSCC county counts with the latest San Mateo County population estimate from the U.S. Census Bureau.